As the ever lasting scroll of the internet took hold of my middle mouse wheel, I stumbled across a gem of a blog post in regards to Amazon Xray and analyzing character screen time. Alex over at curousgnu.com introduced me to connection of sites and meta data through .json. I knew about .json a little in passing through my studies and dabbles into machine learning but still dont know much about the file type or how to navigate it.
Amazon owns IMDB which is one of the largest online databases for above and below the line credits in entertainment, specifically film and television. I am lucky enough to have worked on some great movies in my career and happen to have an IMDB page for myself.
Amazon Prime Video, Amazon’s streaming service, has a great feature for film geeks that allows you to hover your mouse and it shows you the trivia information that you would normally have to visit IMDB for. This information and metadata is located in a json file you can find from doing a simple inspection of the web page.
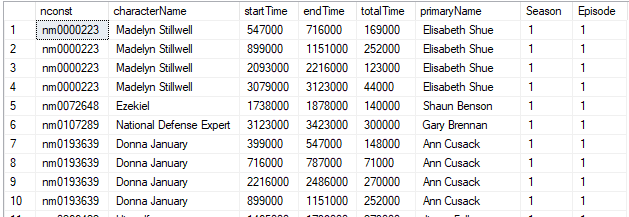
With CuriousGNU’s guidance, I extracted the information needed into a separate csv file that we could use later. I noticed when I decided to analyze The Boys, Amazon Primes dark superhero show, I needed to do this process for each episode in each season. Then connect the all the episodes into one database.
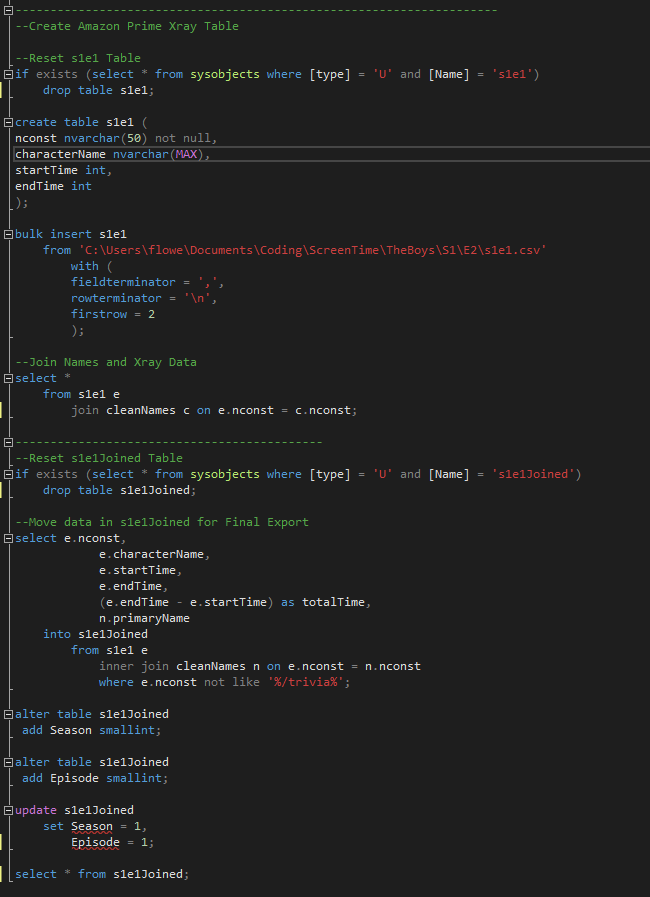
In order to build a dataset that would be able to be integrated into Tableau, I needed to combine all newly created episode .csv into one workable document. This gave me an opportunity to put my new SQL skills to the test. I created a cleaned version of each episode within SSMS, then connected each episode to a cleaned IMDB Names database that connects to the nconst of each xray.
I took the difference of the endTime (ms) and startTime (ms) in order to create a new column called totalTime. This pre-calculation would make it easier to aggregate functions within Tableau.
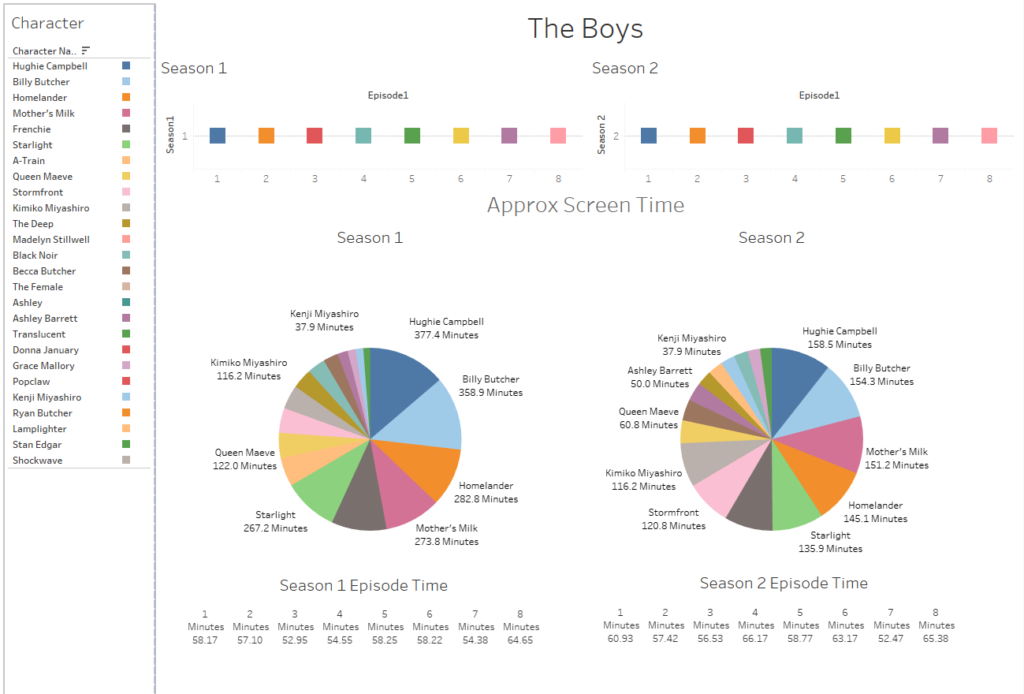
Building the Dashboard
Once I had a working database with episodes and seasons, I created three different sheets that could be used for the dashboards. A pie chart, an episode length sheet, and a season/episode selection sheet to connect the dash board and make it dynamic. I also created a charact sheet that allows you to compare different caracheters in the pie charts depending on what season/episode you choose. This was the first dynamic dashboard I built in Tableau.
While it is very basic, the underlying mechanics of building a dynamic data dashboard were great to learn and implement. If you are interested in looking at the dashboard I will try and upload it later.